Inequality of Opportunity in Cairo: Space, Higher Education, and Unemployment
Introduction
Following the Arab Spring in 2011, many wondered about the economic dimension of the protests in Egypt and across the Middle East. Had inequality, in fact, grown during the previous decades sparking the uprising or did people only ‘perceive’ growing inequality? Data on income inequality at the national-level suggests that inequality actually declined in the years leading up to the uprisings (Verme et al. 2014). Tadamun’s previous analysis discussed multiple dimensions of inequality and argued that a spatial perspective paints a very different picture of inequality than national-level statistics (Tadamun 2015). Analyzing data at the local district and neighborhood level provides a more geographically bounded understanding of inequality, and reveals conditions of spatial inequality that are often obscured by national or governorate level aggregate figures, or even analysis that is divided by urban and rural characteristics.
John Rawls has extended the meaning of inequality to include opportunities. Rawls argues that when there is equal opportunity, “those who are at the same level of talent and ability, and have the same willingness to use them, should have the same prospects of success regardless of their initial place in the social system” (Rawls 1999, 63, emphasis added).[1] This focus on opportunities raises an important question for the study of inequality: To what extent do circumstances shape outcomes for individuals, such as their educational attainment, employment, and incomes?
Inequality of opportunity is very important to many Middle Eastern nations that have spent the past fifty years redressing historical inequities in literacy, education, employment options, and investment policies, among others. In Egypt and many other post-colonial nations, the state invested impressively in education as an important vehicle for generating more equal opportunities and upward mobility, as education helps create the skills to earn a decent living.[2] For example, in the 1947 census, just before Nasser came to power, 80% of the population over the age of 15 could not read or write (UNESCO 1957). Guarantees of free education for all Egyptian citizens and promises of jobs for all graduates were defining features of Nasser’s modernization program (Loveluck 2012). Because of this investment, Egypt made substantial progress in literacy, redressing low female and rural school attendance, and increasing higher education. By 1976, the adult illiteracy rate decreased to 62%, falling further to 52% in 1986 and to 45% by 1996. The last available statistic, from 2013, puts adult illiteracy at 25%.[3] The gender gap is also disappearing over time: in 1971, the illiteracy rate for adult men was 47% while 78% of women could not read or write. By 2013, the illiteracy rate for men stood at 18% and the illiteracy rate for women had dropped to 33%. Finally, higher education enrollment jumped from only 7% in 1971 to 36% in 2015. Roughly equal numbers of men and women were enrolled in tertiary education in 2015 (36.8% of men of university age and 35.5% of women).[4]
Because Egypt’s constitution guarantees free education for every Egyptian, including higher education in public universities, education therefore is a public good. Article 19 of the 2014 Egyptian constitution expresses the aims of the state in providing free public education and reads:
Every citizen has the right to education with the aim of building the Egyptian character, maintaining national identity, planting the roots of scientific thinking, developing talents, promoting innovation and establishing civilizational and spiritual values and the concepts of citizenship, tolerance and non- discrimination. The state commits to uphold its aims in education curricula and methods, and to provide education in accordance with global quality criteria.
The Constitution also guarantees that the state will commit “to allocating a percentage of government spending that is no less than 4% of GDP for education” which will gradually increase to match global rates. More than one-quarter of the education budget goes to higher education (Lindsey 2012).
In theory, the Egyptian university education system serves as a great equalizer. Yet, as Ragui Assaad suggests, this policy has failed utterly in achieving its stated objective due to its poor quality and thus resulted in a higher education system that is as far from the ideal of equality of opportunity as it could possibly be. In fact, “[…] the free public higher education policy is simply ensuring that scarce public resources are generously subsidizing the education of the well-to-do at the expense of the poor, who are virtually excluded from the higher education system” (2010, 1). Not only is access to education in Egypt unequal, but even when people do manage to attain a university degree, the labor market offers no guarantees of equal opportunities to access jobs. In August 2017, the overall unemployment rate stood at 12%, the lowest level since the Arab Spring. However, nearly 80% of the unemployed are young people between the ages of 15 and 29 years old and over 40% of the unemployed have a university degree (CAPMAS 2017).
When opportunities for both educational attainment and employment are unequal, young people must overcome additional barriers to make a successful transition to adulthood. As we will argue here, the extent to which these barriers impede Egyptian’s prospects for success depends, at least partially, on where they live. Geographic isolation, segregation, or simply neighborhoods that vary economically may limit an individual’s opportunities despite their natural abilities, talent, or ambitions.
If geography or residence in a neighborhood determines future outcomes, we must seriously consider the spatial barriers to equality of opportunity. To do so, we draw on the concept of spatial inequality. Spatial inequality is the unequal distribution of resources and services between geographic areas. Importantly, spatial inequality is also concerned with where poverty, wealth, and opportunities are concentrated versus where they are not, and the relationships between those places. Because inequality is multidimensional, this also means that it is often intersectional: when specific areas are disadvantaged in more than one respect, this may produce even greater inequality across space.
Tadamun strives to examine spatial inequality by disaggregating our analysis to the lowest subnational unit—the neighborhood or shiyakha—whenever possible. Typically, analysis of many problems in Egypt depends on data at the regional or provincial level of analysis with variation along a more general urban or rural dichotomy (Milanovic 2014). Yet, when we look at the differences at the local neighborhood scale, we see much more inequality than when we compare the larger geographic units of analysis. From the national or provincial studies, we know that inequality is highest within urban areas, but we know little about how this inequality manifests across space within cities. Cairo, a mega-city of 16-20 million residents, faces many challenges of urban governance, urban planning, and urban development, but we also need to learn more about how the distribution of public goods varies from neighborhood to neighborhood, and how these variations impact employment, unemployment, career paths, or other circumstances among residents. Individual neighborhoods have very different needs and challenges, but without tools for identifying these local needs, achieving the fair spatial investment of public resources in the city remains a far-off goal.
In this brief, we utilize mapping to identify the neighborhoods within the GCR that experience both the best and worst outcomes in education and employment, two main factors that are often contributors to inequality. Through such visualizations, we can gain a sense of how various patterns of educational attainment and employment status are concentrated, and which neighborhoods suffer from multiple issues. For example, we find that some neighborhoods are “doubly disadvantaged,” with both low employment and low university education rates. Meanwhile, other neighborhoods are “doubly advantaged” with high employment rates and high university education rates. The inequality between areas which are “doubly disadvantaged” and “doubly advantaged” is much wider than the inequality just between two neighborhoods which have high university education rates but divergent employment rates, for example. By identifying the areas that are disadvantaged in access to education, employment opportunities, or both, our analysis can help serve as a targeting tool for public investment in those neighborhoods most in need, and particularly those that are disadvantaged on multiple, intersecting dimensions. Tadamun hopes to communicate our analysis to a wider, public audience to increase knowledge about conditions of spatial inequality between neighborhoods within the Greater Cairo Region (GCR) and advocate for a more equitable distribution of public goods, services, and opportunities.
An important caveat to this analysis is that although we can describe this spatial dimension of opportunities we cannot explain the reasons behind them or causality, without far more data which would address many other issues.[5] This analysis rests on the most recent available Egyptian CAPMAS census (2006) and we hope some of the conclusions may be updated as soon as the 2016 census becomes publicly available. This additional data in 2017 will also allow an analysis of change over time, which will help us trace how neighborhood outcomes diverge when there is inequality of opportunity.
Inequality of Opportunity in Access to Education
Though one of the main focal points of this analysis is inequality in higher education rates, differential access to education in Egypt starts much earlier than the university level. According to data from the 2009 Survey of Young People, wealthy students have a much higher probability of attending secondary school than poor students, whether public or private (Population Council 2011). There is a 98% chance that a student whose family is in the top wealth quintile will obtain a secondary education, compared to a 62% chance of finishing secondary school for students in the lowest quintile (Assaad and Krafft 2015, 8). Admission to general secondary school (rather than lower-status technical or vocational schools) is highly dependent on scores from preparatory exams. However, when comparing students from the wealthiest quintile with those from the poorest, even when these students have exactly the same test score, the richest students still have a 20-30% greater chance of attending secondary school compared to the poorest (Assaad and Krafft 2015, 22). The families of wealthy students who do not do well on preparatory exams commonly “buy” access to secondary schooling by sending their children to private tuition-based secondary schools (see Ille 2015).
The fact that students of equal ability (as measured by test scores) attend secondary school at very different rates based on their family income demonstrates the high degree of inequality of opportunity in the Egyptian education system. In other words, circumstances rather than effort largely account for these disparities in access to education. As Assaad shows in an analysis of data on university attainment, “an individual whose parents are both university educated, are from the highest wealth quintile and who live in the urban governorates […] has a 98.5 percent chance of accessing higher education as compared to a 5.5 percent chance for an individual whose parents are both illiterate, are from the lowest wealth quintile and live in rural Upper Egypt” (2010, 2). That difference noted above, between a 98.5% and 5.5% chance of accessing higher education based on these three variables, explains a great deal about the lack of educational mobility in Egypt.
But there is also a spatial dimension when it comes to exclusion from educational opportunities, beyond the difference between living in an urban or rural governorate, which we will now explore in this brief. Within the GCR, the distribution of public schools is not equal between districts (qisms), the subnational unit directly above the neighborhood level. When it comes to primary schools, the number of primary schools in each district does increase with population size (Figure 1) and shows no statistically significant relationship with district poverty rates (Figure 2). This means that both rich and poor districts generally have a proportional number of primary schools in accordance with the size of their population.

Figure 2

Figure 1
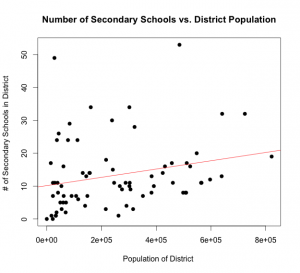
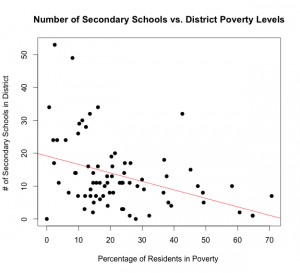
However, the provision of secondary schools is a different story, illustrating the inequality of opportunity between places. The number of secondary schools within a district is only loosely tied to population size (Figure 3). More troubling, there is a negative relationship between the number of secondary schools and district poverty rates (Figure 4). In other words, there are fewer secondary schools in high-poverty districts, areas that would reap the largest benefits from proportional investment in education (Higgins 2016).
This deficit of secondary schools surely limits access to opportunities for children in these poorer districts, which is another factor explaining why poor students have a lesser chance of attending secondary school compared to wealthy students and an even lower probability of obtaining a university education. There simply are not enough secondary schools in poorer districts, which are often more populated than wealthy districts, yet they have fewer schools. For example, in Izbit Khayrallah, one of the largest informal areas in the GCR and home to an estimated 650,000 people, there is only one public primary school and there are no general secondary schools within the neighborhood (Tadamun 2013). This spatial inequality of opportunity in the distribution of schools matters because even if a student is highly qualified for general secondary school, she may not be able to attend one within walking distance if there are few (or no) secondary schools in her neighborhood or even in her district. In particular, public schools are distributed very unevenly throughout informal areas—schools tend to be clustered in just one section of informal areas, leaving students who live in other parts of the informal settlement outside of walking distance to schools (Tadamun 2015). There are other important issues about the quality of schools, in addition to the number of schools, in areas like Izbit Khayrallah that, unfortunately, our data does not allow us to address.
In contrast to the problem of few public schools in informal areas, many sparsely populated districts have a large number of secondary schools. For example, the district of 1st New Cairo had the second highest number of secondary schools (49) amongst all the districts although the population was just 27,000 in 2006.[6] Only 8% of residents of 1st New Cairo live below the poverty line. Yet, Manshiyat Nasser had only one secondary school serving a population of over 260,000 in 2006 where 26% of residents live under the poverty line.[7] The comparison of these two districts is particularly illustrative of the way in which public investment and services are often diverted from highly-populated areas that are most in need in favor of wealthy districts and the sparsely populated new cities.
Though we cannot suggest causality between the number of secondary schools and university education rates, it is no surprise that 48% of residents of 1st New Cairo have a university education, while only 3% of those in Manshiyat Nasser do. Indeed, across the GCR higher education rates vary dramatically from place to place and are closely tied to the number of secondary schools in the district. Figure 5 shows very clearly that there are far more secondary schools in areas where a higher percentage of residents hold a university degree, which is at least suggestive of long-term effects from inequality of opportunity between neighborhoods when it comes to access to education.

Figure 5: Number of District Schools vs. District University Education Rates
The map below (Map 1) is another way of illustrating the same relationship that we see in Figure 5, but bringing into consideration geographic space. The map shows neighborhood-level higher education rates compared with the number of secondary schools in each district, which provides a better illustration of the spatial pattern of inequality of opportunity in access to higher education. The map is color-coded by neighborhood university education rates, which range from less than 1% of residents holding a university degree to just over 88%. The red circles indicate the number of public secondary schools within that district.[8] By mapping this relationship, we are adding a spatial dimension to the concept of inequality of opportunity. Living in certain areas makes educational attainment less likely, in part due to unequal distribution of public services and investment. Due to the spatial inequality of opportunity, students from certain neighborhoods face major barriers to achieving a higher education, particularly those from poor neighborhoods.
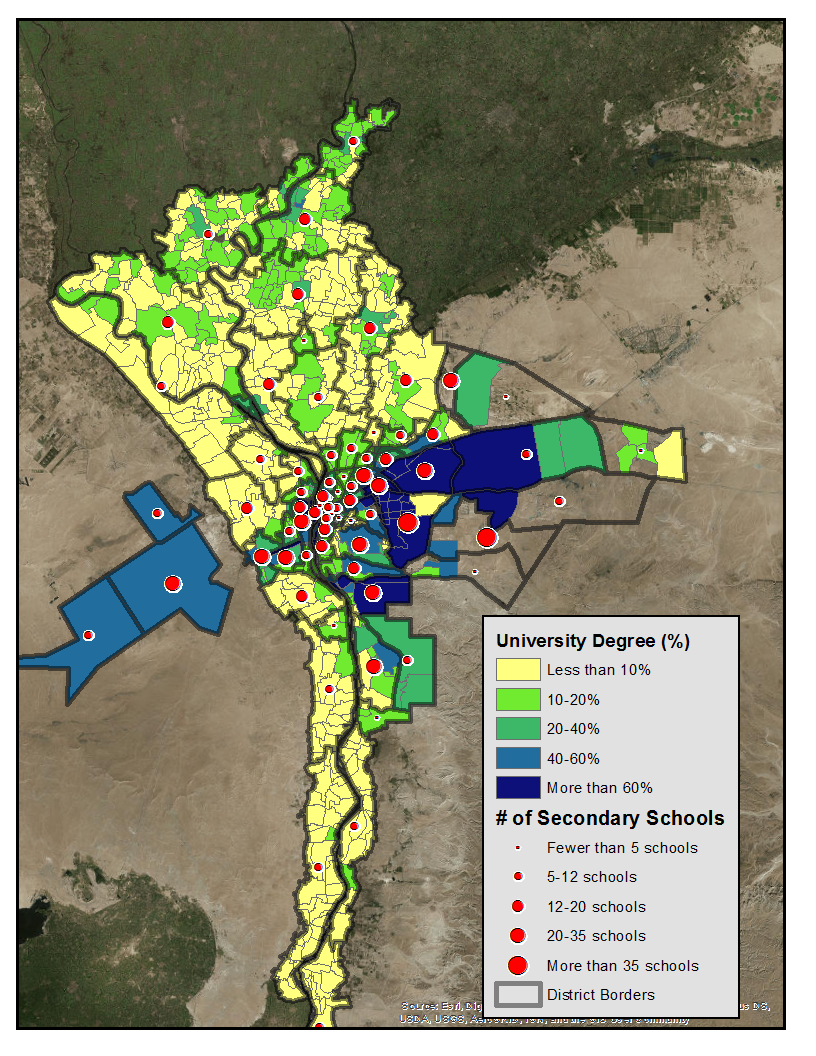
Map 1: Percentage of District Residents with a University Degree vs. Number of Secondary Schools in Each District
Inequality of Opportunity within Employment
Even when people do manage to obtain a university degree, the probability of which increases with income levels, there is still inequality of opportunity in employment. Research has shown that looking at a young person’s educational attainment only goes so far to predict their likelihood of success in making a successful transition to adulthood. Socioeconomic class, gender and their parents’ level of educational attainment—particularly their father’s—impact a young person’s own education level in complex ways, which affect their prospects for finding a job, how long it takes them to find a job, whether they work in the informal or formal sector, and what their wages will be (Assaad and Krafft 2014).[9]
Some research suggests that high unemployment primarily affects the highly educated, those that have the ability to remain unemployed until a suitable job which matches their qualifications comes along (Assaad and Krafft 2015). Given that a large fraction of university graduates come from relatively privileged backgrounds—as a result of inequality of opportunity in educational opportunities that we discussed above—high unemployment amongst university graduates is in some ways a middle-to-upper class problem. But according to neighborhood-level data on university attainment rates (measured as a percentage of neighborhood residents with a university degree) and unemployment rates (as a percentage of the working-age population), we can see that neighborhoods with high education rates are not the only ones that suffer from the highest levels of unemployment.[10] Figure 1 plots the percentage of residents within a neighborhood that hold a university degree against that neighborhood’s unemployment rate. Each dot represents a neighborhood and the colors of the dots correspond to that neighborhood’s per capita income.

Figure 6: University Education Rates (measured as the percentage of neighborhood residents with a university degree) vs. Unemployment Rates (measured as a percentage of the working-age population) in each neighborhood (shiyakha). Each dot represents a neighborhood and the color of the dot is based on the neighborhood’s per capita income.
The blue line in Figure 6 represents the relationship between neighborhood-level university education rates and neighborhood-level unemployment. The relationship is not a linear one. When we look at the far-left side of the graph (neighborhoods where residents have approximately less than a 25% university education rate), we see that unemployment rates generally increase with higher university attainment rates (the slope of the line is positive). These neighborhoods where less than 25% of residents hold a university degree (on the left side of the graph) generally have per capita incomes of less than 7,000 LE as shown by the red and orange dots (when more than 25% of residents hold a university degree, increases in educational attainment rates are associated with decreases in unemployment rates). What this means is that in certain places, particularly poor neighborhoods, higher education may not function as a tool for upward mobility and transitioning to adulthood. In fact, university graduates in some of these neighborhoods may be more likely to be unemployed than those without a degree. We should not neglect the fact that there is a lot of variation in unemployment rates for neighborhoods on this side of the graph. Some of these neighborhoods have unemployment rates that are very near zero, where others have unemployment rates as high as 30%. These neighborhoods with the highest unemployment rates have the lowest rates of university education, which runs contrary to the notion that unemployment in Egypt is primarily an issue for university graduates.
The relationships between university education, income, and unemployment suggest that university education does not provide equal dividends. In other words, the benefits from university education may vary dependent upon one’s neighborhood, particularly its economic character. The wealthiest, highest educated neighborhoods suffer far less from unemployment compared to the poorest, least educated neighborhoods. Neighborhoods where more than 75% of residents have a university degree have per capita incomes above 15,000 LE, more than two times greater than neighborhoods with university education rates at the lower end of the spectrum. Only a few blue and purple (high per capita incomes) neighborhoods have unemployment rates above 10%, indicating that university graduates in these neighborhoods have very little trouble translating education to jobs, an important part of the transition to adulthood. This ties into this brief’s concern with spatial inequality: where one lives either provides or limits opportunities for the individuals living in these neighborhoods.
The spatial pattern of both university education and unemployment rates reflects this relationship. In each of the maps to follow, we compare neighborhoods that are in the top quartile (above the 75th percentile) and bottom quartile (below the 25th percentile) of university education, unemployment, and poverty rates. We do this to show the geographic patterns of neighborhoods that have very different values on these variables, comparing the most well-off with the most disadvantaged neighborhoods. The maps help us answer certain questions about the geography of spatial inequality. Where are neighborhoods in the top quartile clustered? How far apart are neighborhoods in the top and bottom quartile? Are there neighborhoods that are in top quartile of one variable and the bottom quartile of another? Maps 2-7 only include neighborhoods that meet certain criteria, in accordance with cutoffs for each of the variables which correspond to the values in Table 1 below.
Most of the neighborhoods in the top quartile for university education are located either in the city center, the new cities east and west of central Cairo, or in smaller cities in the northern part of the GCR (Map 2.). In total, 216 urban neighborhoods and only three rural neighborhoods have a high university education. Meanwhile, there is more variation in the spatial pattern of unemployment, with high unemployment rates scattered across neighborhoods throughout the GCR (Map 3). There are more urban than rural neighborhoods with high unemployment rates—131 versus 86, respectively. What these maps show is that there is not a clear spatial correlation between these two variables. Though high rates of university education are concentrated in a localized manner in urban areas within the city center, widespread unemployment plagues neighborhoods throughout the GCR, in both urban and rural areas.
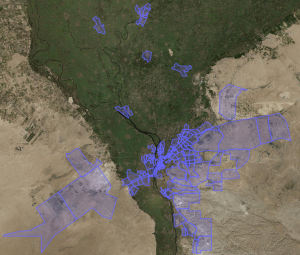
Left, Map 2: High University Education. Neighborhoods which are outlined here, primarily in the city center, are in the top quartile for university education rates.
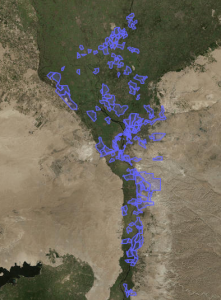
Right, Map 3: High Unemployment. Neighborhoods which are outlined here, which are scattered throughout the GCR are in the top quartile of unemployment.
Notice in Map 2 and 3 that there are some areas of overlap where neighborhoods appear on both maps. In other words, there are neighborhoods with both high university education and high unemployment rates. We can map neighborhoods that fall under each combination of high and low values on these two variables. The interaction of these two variables can help us understand how certain neighborhoods face higher barriers than others, whether it is access to education, employment, or both at the same time. Some neighborhoods face one problem, but not the other. And there are other neighborhoods that enjoy high levels of university education and low unemployment rates. To map these relationships, we utilize the cutoffs for the top and bottom quartiles to map the following combinations:
- Low University and Low Unemployment (Map 4)
- High University and High Unemployment (Map 5)
- High University and Low Unemployment. There are the most advantaged neighborhoods on these two measures, which we refer to as “Doubly Advantaged” (Map 6).
- Low University and High Unemployment. These are the most disadvantaged neighborhoods on both metrics, which we refer to as “Doubly Disadvantaged” (Map 7).
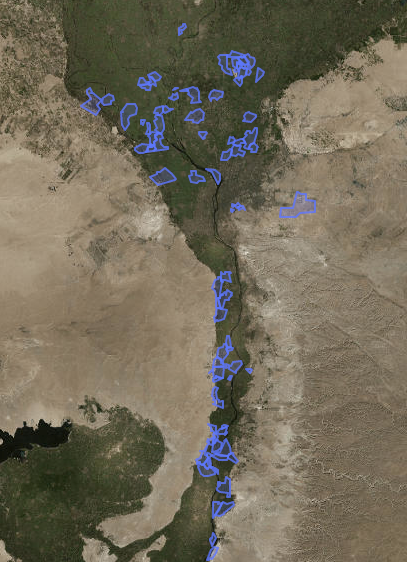
Map 4: Low University Education and Low Unemployment.
The neighborhoods with low levels of university education and low levels of unemployment are primarily rural (Map 4). Seventy-eight of these neighborhoods is in rural areas, while five are in urban neighborhoods. The geographic distribution is unsurprising as we would expect to find neighborhoods fitting these criteria primarily in rural areas, where high levels of educational attainment are generally not necessary for securing employment. In rural areas, informal employment is much more common than formal jobs.[11] In this subset, more than a third of the employed (36%) work in agricultural jobs and 35% of workers hold temporary jobs.[12] Only 16% of the total employed work in the public sector.[13] The scarcity of formal and public sector jobs in rural areas means that low rates of unemployment in these neighborhoods may stem from the fact that young people generally do not wait for a secure job to come along. Although unemployment is low, the lack of decent jobs with good benefits and job security is also a concern.
In contrast, in neighborhoods where there are theoretically more formal job opportunities, youth may be more likely to extend their periods of unemployment as well as the overall unemployment rate until such a job becomes available (Assaad and Krafft 2014). There are 66 neighborhoods in which overall unemployment remains high despite high levels of university education (Map 5). On average, 78% of those employed in these neighborhoods are working in permanent jobs and 40% work in the public sector. Yet, the average unemployment rate is over 13% and in some neighborhoods, it is as high as 19%. Assuming that these neighborhoods reflect the overall trend in Egypt where the vast majority of the unemployed are young people and university graduates, what this suggests is that to some degree high levels of unemployment may be due to young university graduates waiting to enter the labor market. More than one-third of university graduates who are unemployed feel that the job opportunities available to them do not match their qualifications, confirming that there is a shortage of jobs available for educated, highly skilled workers (Barsoum et al 2014). The promise of university education, at least historically during the Nasser years (1952-1970), was that one could obtain a secure, formal job, typically in the public sector, with all of the benefits that come with it. Particularly in these neighborhoods, university education does not seem to pan out exactly as promised.
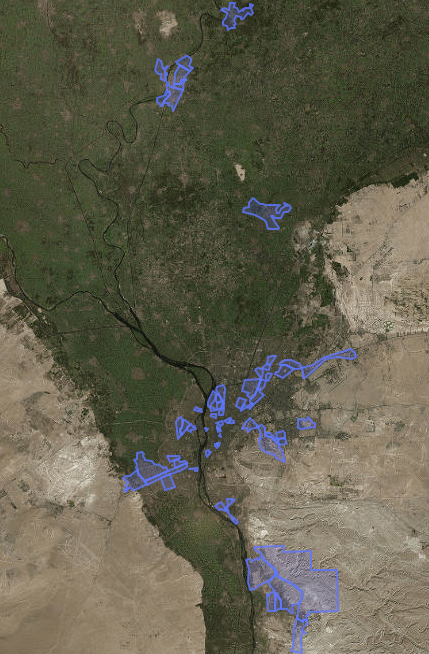
Map 5: High University Education and High Unemployment.
These neighborhoods reflect the overall trend in Egypt of high unemployment rates for university graduates.
Doubly Advantaged
There are 26 neighborhoods that are in the top quartile for higher education rates and in the bottom quartile for unemployment (Map 6). These neighborhoods are “doubly advantaged” on each of these metrics in that they reap the dual benefits of high education rates and low unemployment. Map 6 shows the location of these neighborhoods. Unsurprisingly, these neighborhoods are all located in either Central Cairo or in the new, more expensive areas of the GCR, to the east and west. Many of these neighborhoods are very close, or even adjacent, to those shown in Map 5, demonstrating that spatial inequality can be found by examining employment rates between neighborhoods that are all in the top quartile for university education rates. In doubly advantaged neighborhoods, an average 81% of workers are employed in permanent jobs, which is about equal to the high unemployment neighborhoods shown in Map 5, but the majority of jobs in these high-employment neighborhoods are in the private sector (59% on average). Although the private sector is typically higher-paying than the public sector, it may not come with the benefits that government jobs offer. As discussed above, job security—more readily obtained through public sector jobs—was a major promise of Egypt’s higher education policy which continues to go unfulfilled.
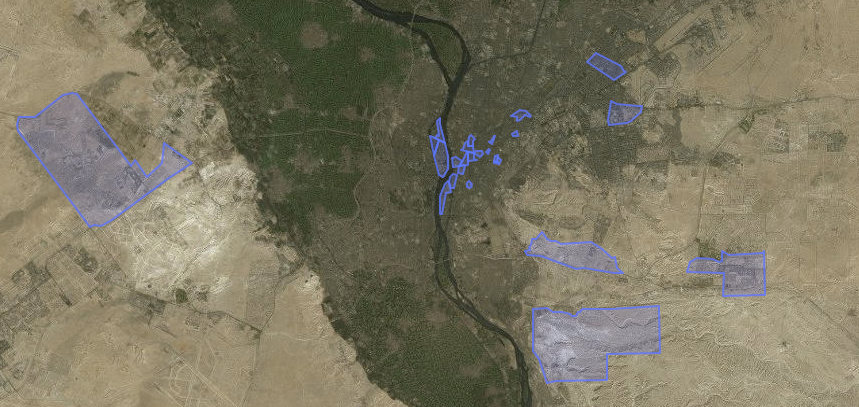
Map 6: High University Education and Low Unemployment Rates (“Doubly Advantaged” Neighborhoods)
Doubly Disadvantaged
Finally, there are 31 “doubly disadvantaged” neighborhoods that are in the bottom quartile for university education and in the top quartile for unemployment rates. Map 7 shows that there is some variation in the spatial distribution of these neighborhoods. The majority of these “doubly disadvantaged” neighborhoods are in the northern and southern parts of the GCR. Many rural areas in the northern part of the region fall into this group as well as quite a few neighborhoods south of Helwan, an area with a heavy concentration of industry. In these neighborhoods, the average unemployment rate is 16% and the average university education rate is only 4.7%. Additionally, the average illiteracy rate is 57%, the average poverty rate is 51%, and the average per capita income is only 4,100 LE. In actuality, these neighborhoods are more than doubly disadvantaged; they are disadvantaged across multiple indicators and speak to the ways in which neighborhood poverty limits opportunities for its residents.
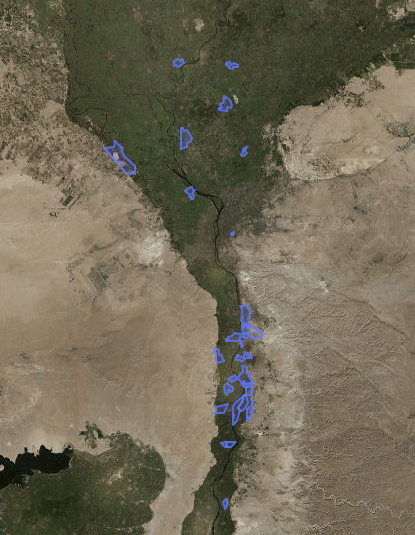
Map 7: Low University Education and High Unemployment Rates (Doubly Disadvantaged Neighborhoods)
We have devoted only some of this brief to discussing the relationship between poverty, educational attainment, and employment. We know that high levels of poverty are very closely associated with lower levels of educational attainment and that the distribution of general secondary schools limits opportunities for students in poor districts. However, poverty’s relationship to employment outcomes is less straightforward. Generally, in high poverty and particularly rural areas, jobs do not necessarily require a university degree, so the fact that students face significant barriers to pursuing higher education may not affect employment outcomes as much as it may elsewhere.
Some low-income neighborhoods exceed expectations when it comes to their university graduation rates. There are four neighborhoods in the GCR that have high poverty rates (in the top quartile) and high university education rates also in the top quartile, bucking the overall trend of the exclusion of poor youth from the higher education system. Although these neighborhoods exceed expectations for university graduation rates given their level of poverty, this does not necessarily result in higher levels of employment since two of these neighborhoods (Manshiyat Naser and Helwan El Gharbia as seen in Map 8) are also in the top quartile of unemployment. There are no neighborhoods within the dataset that simultaneously have high poverty rates, high university graduation rates, and low unemployment rates. What this suggests is that neighborhoods with spatially concentrated poverty only very rarely achieve high educational attainment rates, and even when people do manage to graduate from university, their odds of obtaining a job remain low.

Map 8: High Poverty and High University Education, but High Unemployment Rates. These two neighborhoods, Manshiet Nasser and Helwan El Gharbia exceed expectations for educational attainment based on their poverty rates but still suffer high unemployment.
Conclusion
In this brief, we have shown that inequality of opportunity in access to education and unemployment each have a spatial dimension. The provision of secondary schools is related more closely to district wealth and poverty rather than its population size. Given that secondary school is a prerequisite for entering university, the lack of an adequate number of secondary schools means that educational attainment stagnates in certain areas, limiting the opportunities for students to further their education.
Where employment outcomes are usually a result of educational attainment, we can say with some degree of certainty that a neighborhood’s level of university education has a causal effect on unemployment rates. Unsurprisingly, the most privileged neighborhoods—those with high per capita incomes and high university education rates—generally have lower unemployment rates. We also find that even when neighborhoods have higher rates of university education than we might expect given their level of poverty, this does not translate into gains in employment. On the other side, there are zero neighborhoods in which both poverty rates and educational attainment are high, yet another illustration of the way the university education system privileges the wealthy. This also shows exactly who is a part of the cohort of unemployed university graduates. Individuals from wealthy neighborhoods do not appear to have the same difficulties in obtaining jobs after graduating from university that many young Egyptians face. The more disadvantaged the neighborhood, the higher the barriers to success. Thus, where one lives has a major impact on future trajectories, which has the potential to further solidify inequalities between places.
More generally, our analysis reveals that where one lives plays a role in shaping the educational and employment opportunities available. Determining where inequality of opportunity hits the hardest is useful for designing educational interventions and labor policies, as well as determining appropriate levels of private and public investment and resources to alleviate unequal opportunity. Within urban Cairo, the poorest areas tend to be heavily populated. Given that CAPMAS statistics show that the number of Egyptian children below the age of 18 reached 33.3 million in June of 2016 (representing 36.6 percent of the total population), the future outlook does not look good for equality of opportunity in terms of either access to education or employment for these young people (Egypt Independent 2016). As more and more young people come of age, inequality of opportunity will exacerbate ‘waithood,’ the period of delayed transition between adolescence and adulthood, caused by a long waiting period for permanent or ‘decent’ employment, delayed marriage (due to its high cost for young people and their families), and continued challenges in achieving social and political agency, confounded by the return to authoritarian/military rule (Singerman 2011). Obstacles for a successful transition to adulthood are particularly difficult to surmount for young people in poor neighborhoods who are excluded from higher education, but there are also obstacles for those with a higher education given that high unemployment rates also affect university graduates in certain neighborhoods.
More resources are needed to alleviate inequality of opportunity in education, particularly at the level of secondary school. More investment in secondary education, particularly in poor areas, would create greater equality of opportunity for completion of secondary school as well the pursuit of higher education. Eventually, this might mean that the free-for-all higher education policy would be truly accessible to all, rather than primarily a subsidy for the wealthy who make up a large percentage of university students. The distribution of secondary schools should be tied only to population size; it should not be the case that poor districts have fewer schools per capita than rich districts. However, what we really need is more attention to the number of schools at the neighborhood level (and their quality) in order to ensure that new school projects within the district are not going to neighborhoods that already have them, but rather to the neighborhoods that are most in need. In addition, local communities need access to information about these key indicators and a greater share in directing public resources and development decision-making to the neighborhoods most in need of additional support.[14]
When it comes to inequality of opportunity in employment, decent jobs for both university graduates and those without a degree must be a priority. The state promotes economic growth in its national plans but national policies should focus on employment and jobs as the main driver of growth, and seek to avoid the type of growth which only benefits the wealthy. And because there are geographic patterns when it comes to unemployment, if creating decent jobs does not become a priority, this will only exacerbate spatial inequality.
We have identified neighborhoods where unemployment is particularly high; these are places which may benefit the most from job creation efforts within the area, ideally the creation of jobs that 1) match the qualifications of those living in the neighborhood/area, as measured by educational attainment and 2) contribute to the neighborhood/area by taking into consideration its needs (such as a need for infrastructure, health clinics and other projects that would double as employment opportunities and much needed neighborhood services).
Improving the targeting of public expenditures to doubly disadvantaged neighborhoods can only occur if the current centralized budget process is transformed. Local officials, working from neighborhood-level data, must be allowed and expected to have more of a role in how ministerial budgets are formulated and implemented. The public, at the local neighborhood and district level, must be allowed far more participation in articulating their needs and securing public funds to address them. Local voices and local data offers policy makers the ability to better understand national challenges. The entire budgetary and planning process must redress the unfair and spatially unjust allocation of public funds.
Too often, where a person live determines the possibilities available to him or her, a fact which is true in many places around the world, not just Egypt. When this is the case, not only is their inequality of opportunity but there is also a spatial injustice.
Ideally, complete spatial justice would mean equal access of all citizens to public facilities and/or services, such as schools, hospitals, or cultural centers; jobs; or amenities, measured in distance and/or the number of people served. A more sophisticated definition of spatial justice suggests equal access to their choice of all of the above, meaning that citizens should be able to choose employment options and careers, which schools they send their children to, or which hospitals or health clinics best serve their needs. Spatial justice is about the quality of public goods and services within a neighborhood as much as it is about the quantity (Tadamun 2015).
Though we cannot make any claims about the causes of spatial inequality and injustice without more data, TADAMUN believes that our maps and analysis can serve as a targeting tool for alleviating the ways in which geography contributes to inequality of opportunity. This analysis is merely suggestive since we are awaiting the release of the 2017 Egyptian census data and the possibility of more robust analysis. Yet, TADAMUN urges the Egyptian government and its statistical and planning agencies to make far better use of data to begin directing more targeted, representative, and fair public resources to the doubly disadvantaged neighborhoods and those suffering from spatial injustice and inequality of opportunity.
Citations
Assaad, R. (2010). “Equality for All? Egypt’s Free Public Higher Education Policy Breeds Inequality of Opportunity.” Economic Research Forum Policy Perspective No. 2. Cairo, Egypt.
Assaad, R. & Krafft, C. (2014). “Youth Transitions in Egypt: School, Work, and Family Formation in an Era of Changing Opportunities.” Silatech Working Paper 14-1. Retrieved October 23, 2017, from: http://www.silatech.org/docs/default-source/publications-documents/youth-transitions-in-egypt-school-work-and-family-formation-in-an-era-of-changing-opportunities.pdf?sfvrsn=6
Assaad, R. & Krafft, C. (2015). “Social Background and Attitudes of Higher education Students and Graduates in Egypt.” Retrieved October 23, 2017from: http://arabhighered.org/wp-content/uploads/2015/11/Assaad-and-Krafft-Summary-Social-Backgrounds.pdf
Barsoum, G.; Ramadan, M.; & Mostafa, M. (2014). “Labor Market Transitions of Young Women and Men.” Work4Youth Publication Series. No. 16. Retrieved February 12, 2018 from http://www.ilo.org/wcmsp5/groups/public/@dgreports/@dcomm/documents/publication/wcms_247596.pdf
CAPMAS (2017). “Press Release.” (In Arabic). May 15. Retrieved October 23, 2017, from: http://capmas.gov.eg/Pages/ShowHmeNewsPDF.aspx?page_id=/Admin/News/PressRelease/2016515145044_1111.pdf&Type=News
Constitution of the Arab Republic of Egypt [Egypt], 18 January 2014, Retrieved February 12, 2018 from http://www.refworld.org/docid/3ae6b5368.html
Egypt Independent (2016). “Over One-Third of Egypt’s Population Children: CAPMAS.” November 20, Retrieved October 23, 2017 from http://www.egyptindependent.com/over-one-third-egypt-s-population-children-capmas/
Galster, G. C., & Killen, S. P. (1995). The Geography of Metropolitan Opportunity: A Reconnaissance and Conceptual Framework. Housing Policy Debate, 6, 7-43.
Hammouya, Messaoud. (1999). “Statistics on Public Sector Employment: Methodology, Structures and Trends.” Bureau of Statistics, International Labour Organization, SAP 2.85/WP.144, Geneva Switzerland. Retrieved October 23, 2017, from http://www.ilo.org/wcmsp5/groups/public/—dgreports/—stat/documents/publication/wcms_087888.pdf
Higgins, Danielle. (2016). “Analyzing Spatial Inequality in Cairo: A Look at Variation in Poverty, Inequality and Service Provision Across Districts and Neighborhoods.” Paper, American University.
Hopkins, N.S. (2015). “The Political Economy of the New Egyptian Republic.” Cairo Papers Vol. 33, Issue 4.
Ille, S. (2015). Contrived Private Tutoring in Egypt: Quality education in Deadlock between Low Income, Status, and Motivation. Egyptian Center for Economic Studies Working Paper No. 78. Cairo, Egypt.
ILO (n.d.) “Decent Work.” Retrieved October 23, 2017, from http://www.ilo.org/global/topics/decent-work/lang–en/index.htm
ILO (2003). “Report of the Conference: Seventeenth International Conference of Labour Statisticians, 24 November–3 December 2003.” ICLS/17/2003/4, Geneva, Switzerland. Retrieved October 23, 2017 from http://www.ilo.org/wcmsp5/groups/public/—dgreports/—stat/documents/meetingdocument/wcms_087585.pdf
Lindsey, U. (2012). “Freedom and Reform at Egypt’s Universities.” September 4. Carnegie Endowment for International Peace, Retrieved February 12, 2018 from http://carnegieendowment.org/2012/09/04/freedom-and-reform-at-egypt-s-universities-pub-49212
Lobao, L., and Saenz, R. (2002). “Spatial Inequality and Diversity as an Emerging Research Area.” Rural Sociology 67(4), pp. 497–511.
Loveluck, L. (2012). “Education in Egypt: Key Challenges.” March, Middle East and North Africa Programme, Chatham House, Retrieved February 12, 2018 from https://www.chathamhouse.org/sites/files/chathamhouse/public/Research/Middle%20East/0312egyptedu_background.pdf
Milanovic, B. (2014). “Spatial Inequality.” In P. Verme, B. Milanovic, S. Al-Shawarby, S. El Tawila, M. Gadallah & E.A.A. El-Majeed (Eds.), Inside Inequality in the Arab Republic of Egypt.: Facts and Perceptions Across People, Time and Space (pp. 37-54). World Bank, Washington, D.C.
Population Council, (2011). Survey of Young People in Egypt: Final Report. West Asia and North Africa Office, January, Cairo, Egypt.
Rawls, J. (1999). A Theory of Justice. Cambridge, MA: Harvard University Press; originally published 1973.
Singerman, D. (2011). “The Negotiation of Waithood: The Political Economy of Delayed Marriage in Egypt.” In Arab Youth: Social Mobilisation in Times of Risk, Samir Khalif; Roseanne Khalif, eds., pp. 67-78. London: Saqi Books.
Tadamun: The Cairo Urban Solidarity Initiative. (2013). “`Izbit Khayrallah.” Retrieved October 23, 2017, from www.tadamun.co/?post_type=city&p=2741&lang=en&lang=en
Tadamun: The Cairo Urban Solidarity Initiative. (2015). “Inequality and Underserved Areas: A Spatial Analysis of Access to Public Schools in the Greater Cairo Region.” September 8. Retrieved October 23, 2017, from http://www.tadamun.co/inequality-underserved-areas-spatial-analysis-access-public-schools-greater-cairo-region/?lang=en#.XegLFZJKjjA
Tadamun: The Cairo Urban Solidarity Initiative. (2015). “Adequate Housing Approach as a Targeting Tool for Local Development.” December 31, Retrieved October 23, 2017 from http://www.tadamun.co/adequate-housing-approach-targeting-tool-local-development/?lang=en#.XegLh5JKjjA
Tadamun: The Cairo Urban Solidarity Initiative. (2015). “Investigating Spatial Inequality in Cairo.” December 31. Retrieved October 23, 2017 from http://www.tadamun.co/investigating-spatial-inequality-cairo/?lang=en#.XegLwJJKjjA
UNESCO. (1957). “World Literacy at Midcentury: A Statistical Study.” Retrieved February 12, 2018 from http://unesdoc.unesco.org/images/0000/000029/002930eo.pdf
Verme, P.; Milanovic, B.; Al-Shawarby, S.; El Tawila, S.; Gadallah, M.; El-Majeed, E.A.A. (2014). Inside inequality in the Arab Republic of Egypt: Facts and Perceptions Across People, Time, and Space. Washington DC; World Bank Group.
[i] While countries differ in how close they are to the ideal of full equality of opportunity, there is no place in the world where opportunities are distributed completely equally throughout society. Family wealth, connections to economic and political power, and discrimination based on gender, race, ethnicity, national origin, social class, religion, sexual orientation, or citizenship status are just some factors which limit perfectly equal access to opportunities for all persons.
[ii] When we say “decent living” or “decent jobs” we are referring to the ILO’s definition of decent work which encompasses “work that is productive and delivers a fair income, security in the workplace and social protection for families, better prospects for personal development and social integration, freedom for people to express their concerns, organize and participate in the decisions that affect their lives and equality of opportunity and treatment for all women and men” (n.d.).
[iii] See https://data.worldbank.org/indicator/SE.ADT.LITR.ZS?locations=EG for statistics on illiteracy rates for the total adult population, as well as male and female illiteracy rates, over time from the 1970s to 2013. These indicators—and the tools to visualize them–can be found in the World Bank’s DataBank catalogue. The source for education statistics is the UNESCO Statistics Institute.
[iv] See https://data.worldbank.org/indicator/SE.TER.ENRR?locations=EG for more information on university enrollment and attainment rates.
[v] Additionally, our data represents neighborhood-level averages; it does not tell us whether individual persons who are university graduates are also unemployed. But because we know that such a large percentage of the unemployed are young people with a university education, it is not unreasonable to assume that these neighborhood averages mirror, at least to some degree, the experience of individuals who live there. In other words, if a neighborhood has high university education rates and high unemployment rates, it is very likely that many of the individuals who have a university degree also are among the ranks of the unemployed.
[vi] For context, compare this to the mean population of all districts which is 251,035; comparing the 2006 census data on population with the 2013 poverty map data on population shows that between 2006 and 2013, the population of 1st New Cairo grew by only 4,000.
[vii] Our data shows that the mean poverty rate for districts is 23%; the median is 19%. By 2013, the population had increased by more than 40,000.
[viii] The position of the dots are not representative of the location of schools; longitudinal and latitudinal data for school locations is only available for certain parts of the GCR. The dots instead represent the total number of secondary schools in each district.
[ix] According to the ILO’s guidelines concerning the statistical definition of informal employment, informal jobs describe “an employment relationship that is, in law or in practice, not subject to national labor legislation, income taxation, social protection or entitlement to certain employment benefits (advance notice of dismissal, severance pay, paid annual or sick leave, etc.)” (2003, p. 51). In contrast, formal employment is subject to all applicable labor laws, protections and regulations.
[x] Our data comes from the most recent (2006) census and captures information on 869 shikyahas (neighborhoods) within the GCR.
[xi] See Footnote 7.
[xii]Temporary jobs may refer to jobs where there is a fixed-term contract seasonal jobs or day labor. Temporary jobs exist in both the public and the private sector, and the formal and informal economy (Hopkins 2015).
[xiii] The ILO defines the public sector as “all market or non-market activities which at each institutional level are controlled and mainly financed by a public authority (1999).”
[xiv] See Tadamun 2015 for a discussion about the minimal role that the local scale has in the budgeting process in Egvpt. Local Popular Councils (LPC) (inactive since 2011) review and pass the budget of agencies operating at the local level only, . . . but they are hindered by legislation – in particular the Local Administration Law No. (43/1979) – which gives ministries the final say in evaluating needs and setting the corresponding budgets at the district level.
Featured image by:Dan




Comments